Find out what makes you profitable — and repeat it.
Profitable traders don’t guess: they measure. Stratonk turns every trade into data, so you can see what works, cut what doesn’t and build a real statistical edge.
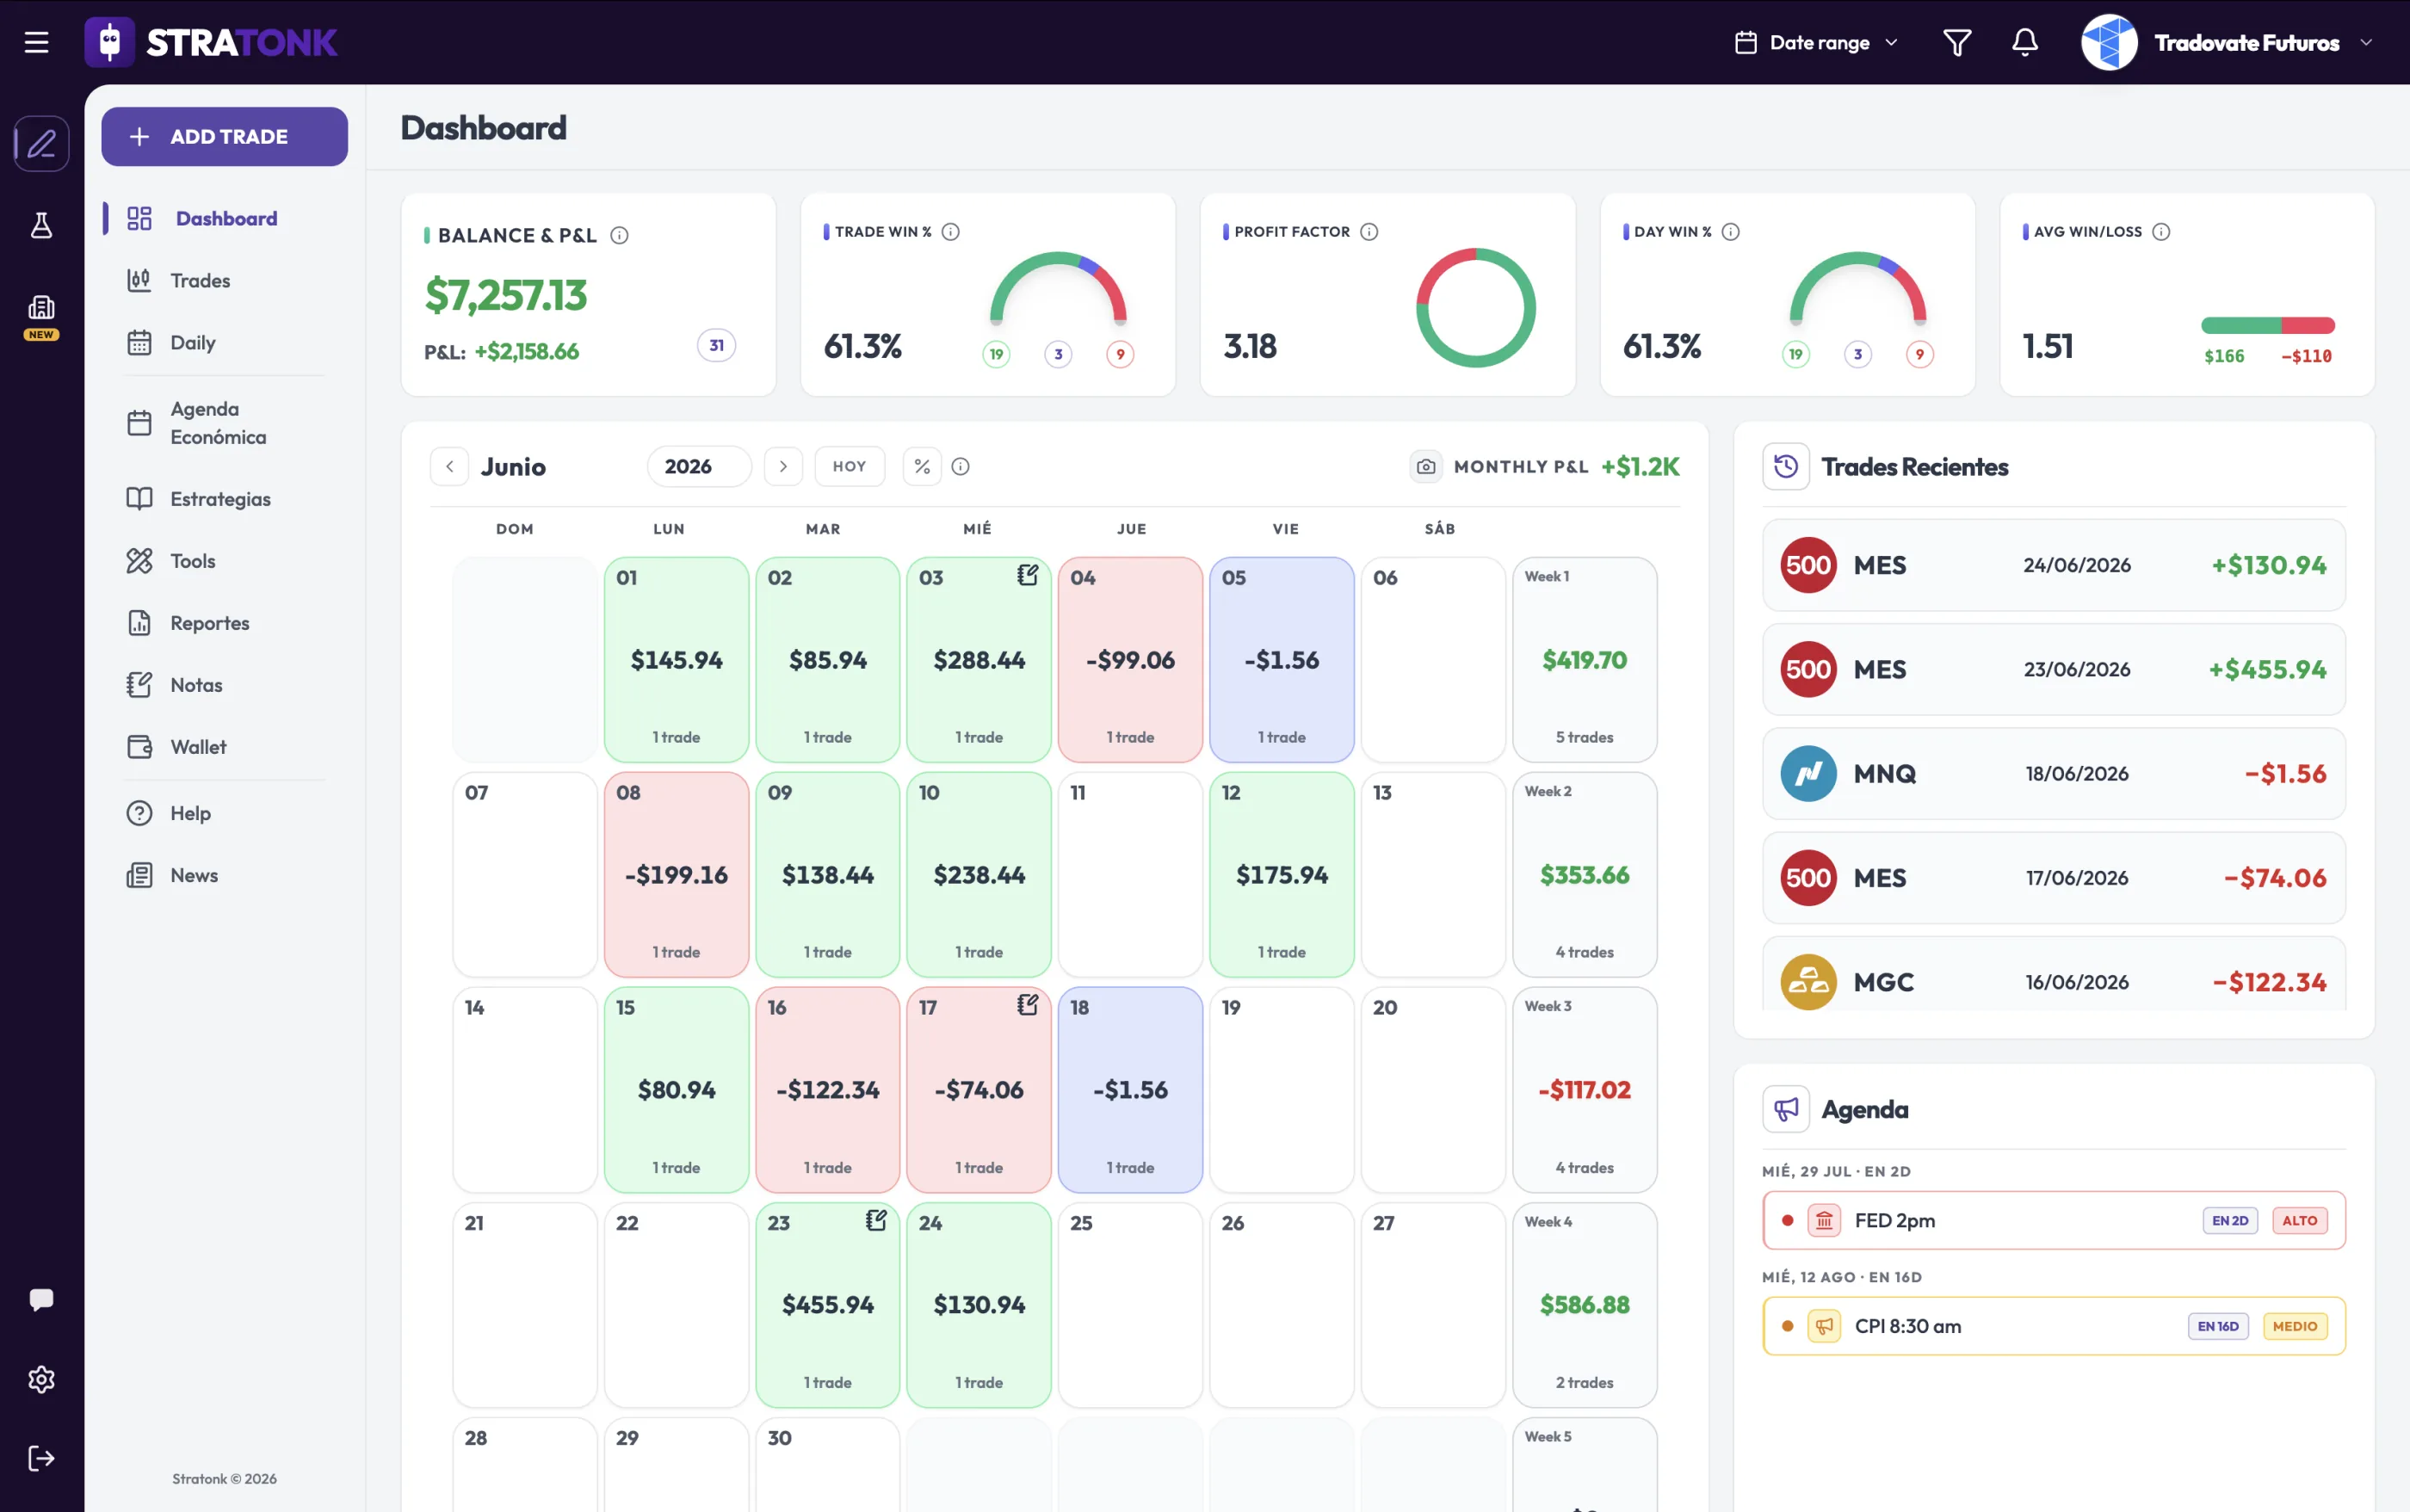
- Trading journal
- Backtesting
- Trade Replay
- Prop Firm Sync
- Reports
- Strategy Tracking


With Stratonk you don’t have a journal,
you have a system.
Everything you can do with it.
You can’t improve
what you don’t measure.
A trader working without a system is bound to fail.
The only way to become profitable is trading with a statistical edge.
How it works
Three simple steps.
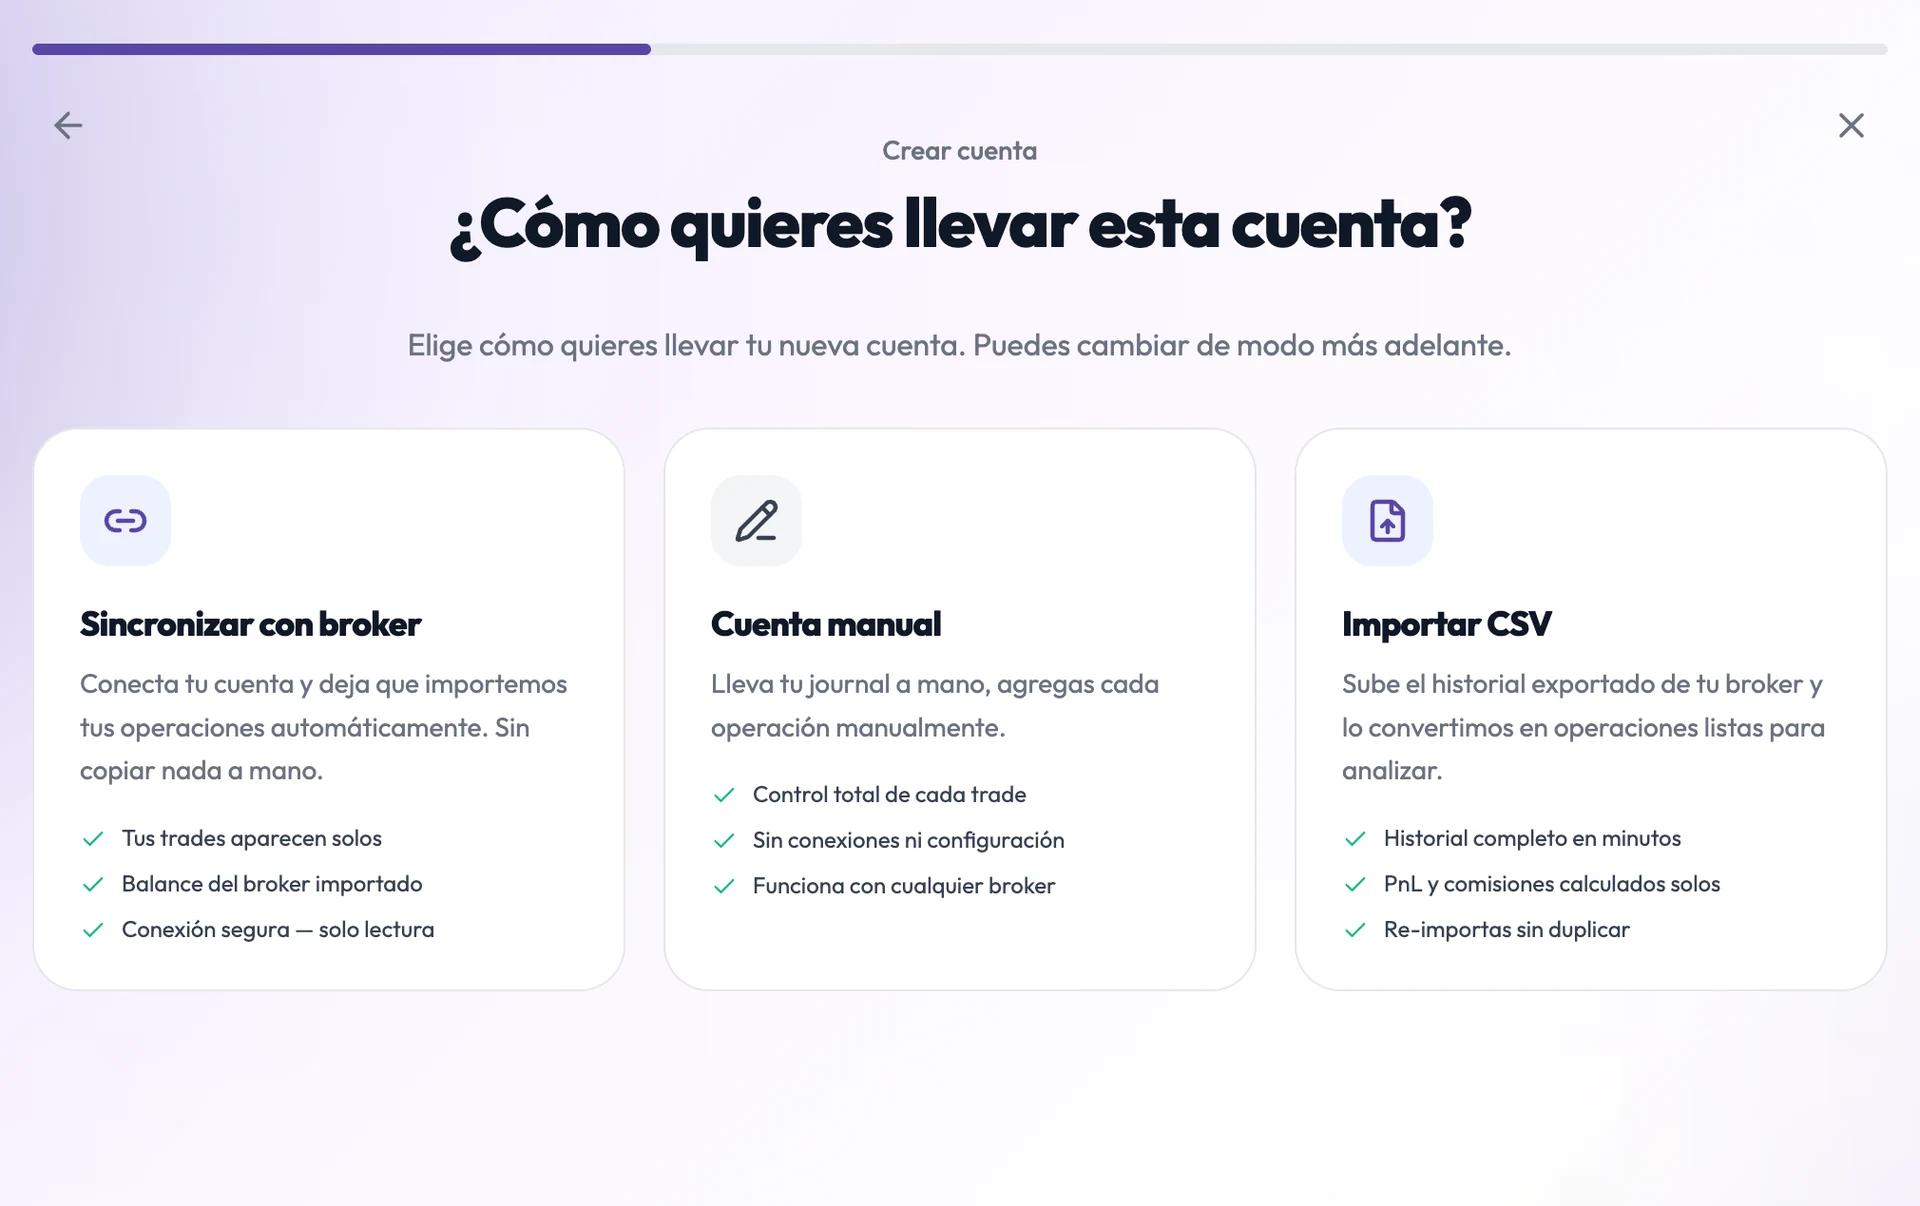
Log your trades.
Bring in your broker history: connect the account and your trades come in on their own, upload the CSV you export from it, or log them by hand if you would rather keep it yourself.
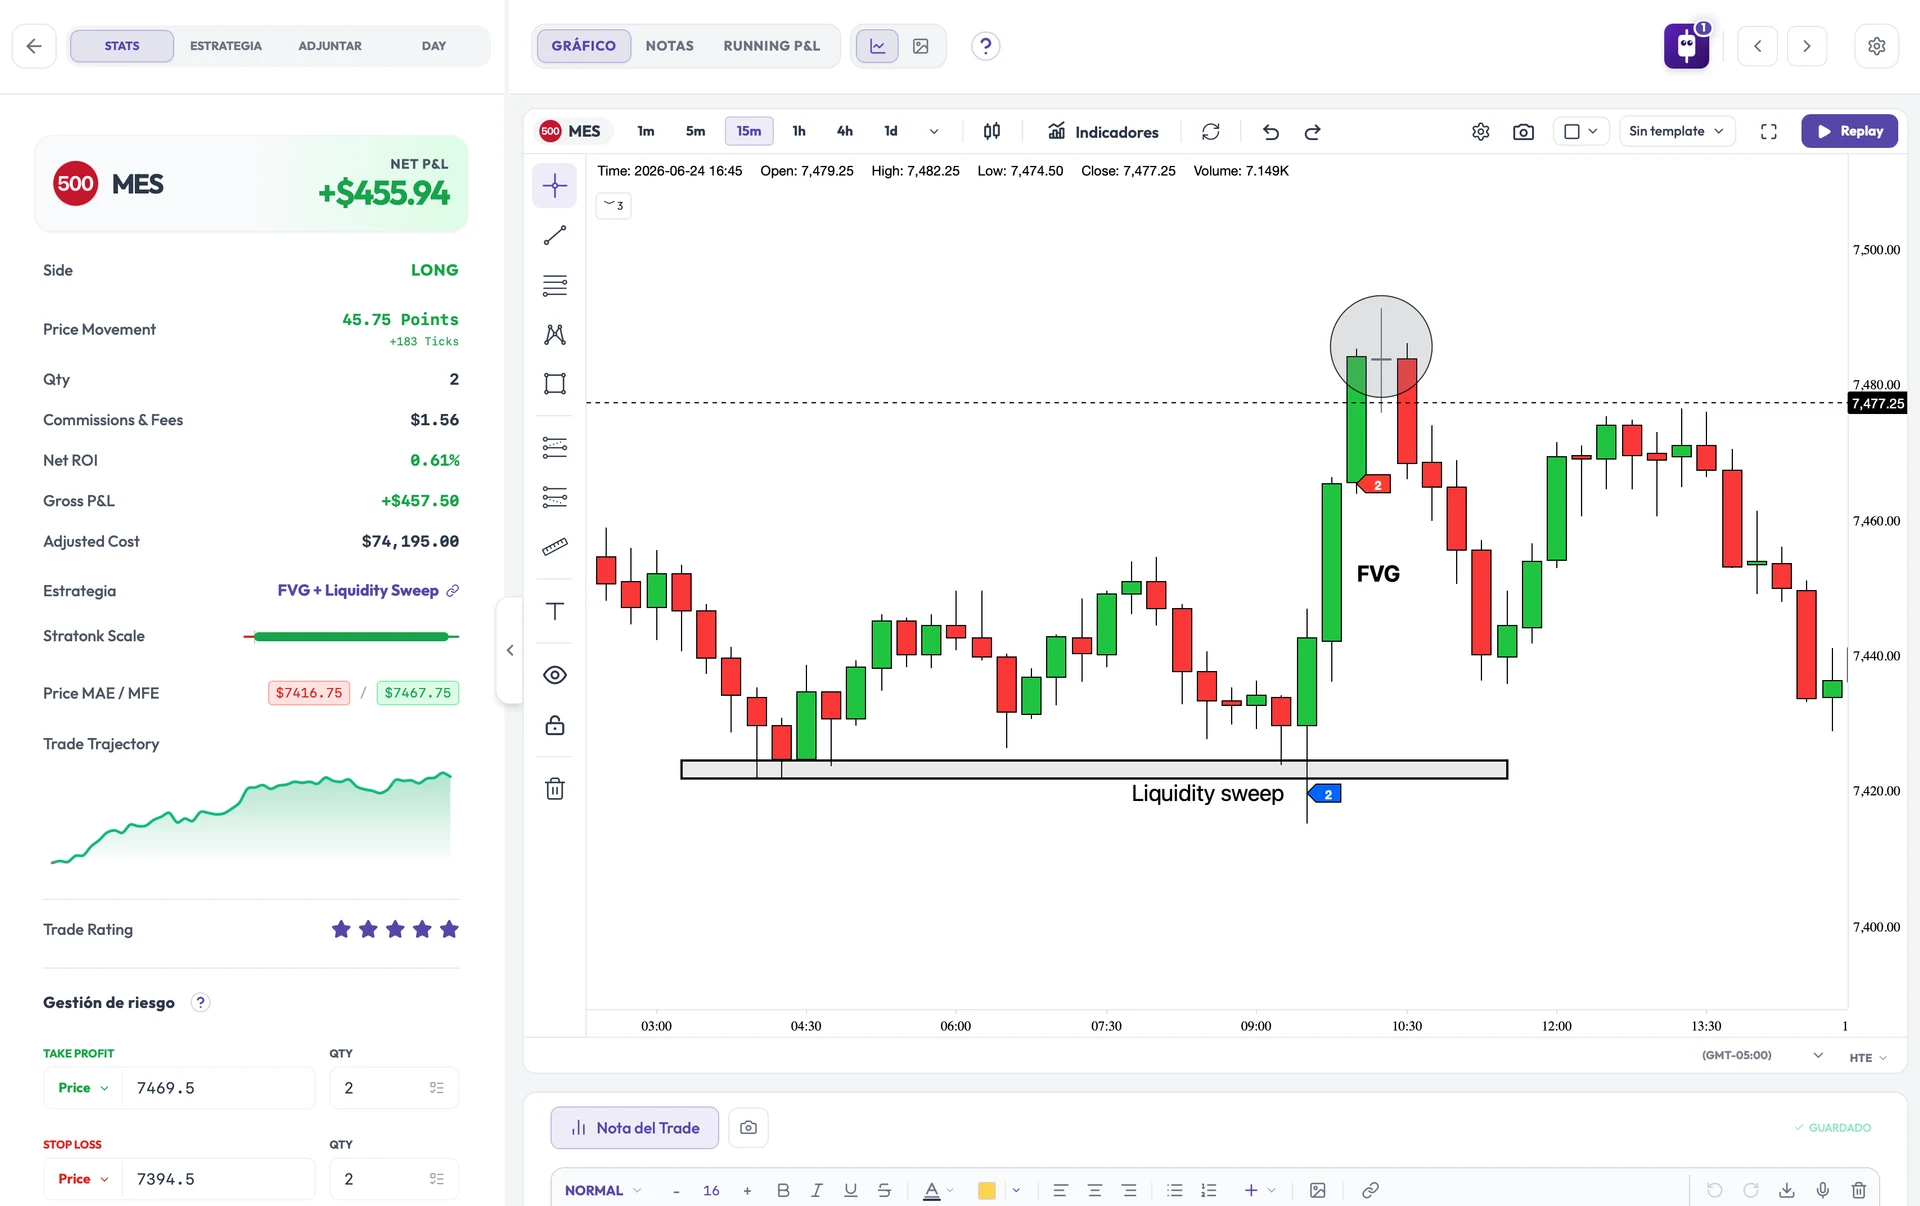
Metrics, automatically.
Profit factor, win rate, R:R, ROI and the rest come out on their own — no formulas to write. And every trade is drawn on its chart, marking where you got in and where you got out.
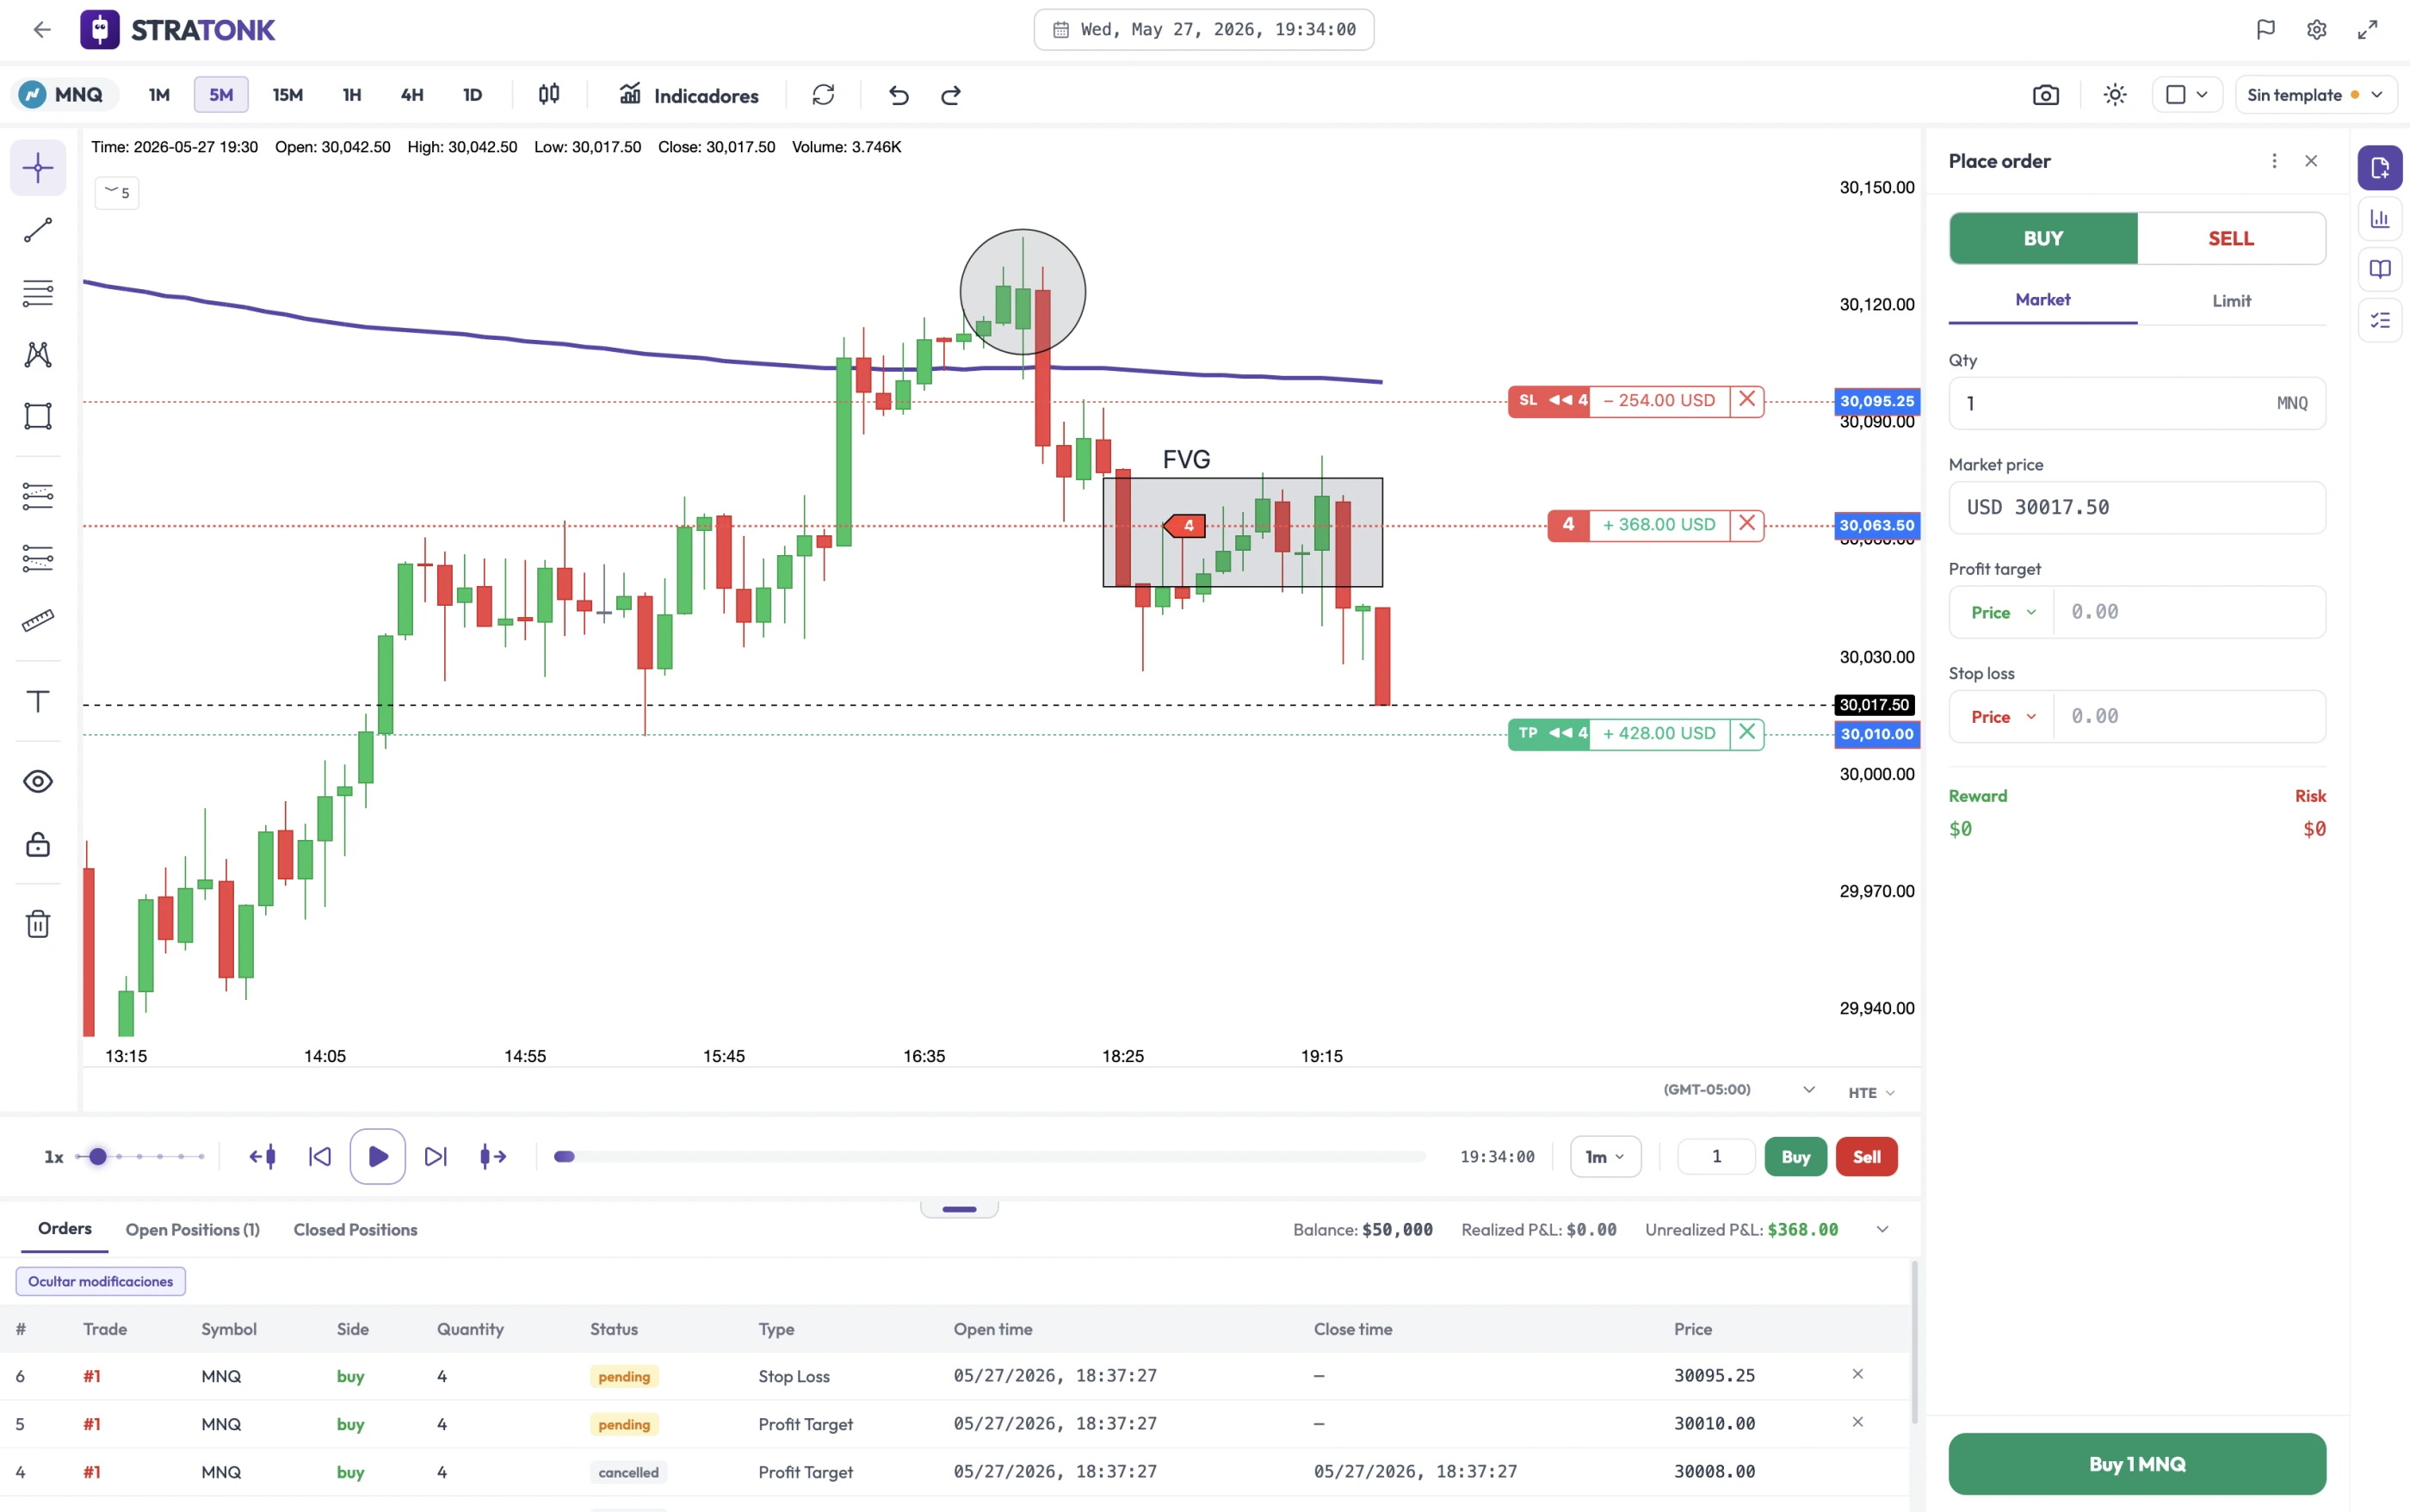
Review and improve.
Go back over any trade in Replay mode: relive it watching the market move candle by candle, exactly as it was that day. You see what actually happened and what you decided. That is the difference between a trade you forget and one you learn from.
Log your trades.
Bring in your broker history: connect the account and your trades come in on their own, upload the CSV you export from it, or log them by hand if you would rather keep it yourself.
Metrics, automatically.
Profit factor, win rate, R:R, ROI and the rest come out on their own — no formulas to write. And every trade is drawn on its chart, marking where you got in and where you got out.
Review and improve.
Go back over any trade in Replay mode: relive it watching the market move candle by candle, exactly as it was that day. You see what actually happened and what you decided. That is the difference between a trade you forget and one you learn from.
Is your strategy profitable, or does it just look like it works?
Backtest to gather data and build a statistical edge. Validate first, put capital behind it after.
Your spreadsheet stores the numbers…
but it doesn’t understand them.
A spreadsheet only stores data. Stratonk turns it into metrics, charts and decisions that improve your trading.
| Feature | Stratonk | Excel |
|---|---|---|
| Price | $29/mo · $19/mo (annual) | Free, but manual |
| Automatic metrics | You write the formulas | |
| Performance charts | You build them | |
| Backtesting platform | — | |
| Candle-by-candle Trade Replay | — | |
| AI analysis | — | |
| Spots your patterns and mistakes | — | |
| Access from your phone | Limited |
What is it worth
to become profitable?
Cancel any time. 7-day free trial.
Stratonk
- Unlimited accounts
- 3 GB of storage
- Prop firm account tracking
- Unlimited backtesting
- Trade Replay
- One-second data
Frequently asked questions.
What traders ask us most before they start.
How will Stratonk change my performance? You trade on data, not on instinct
Stratonk gives you the control you don’t have over your trading today:
- You know what makes you profitable. You trade with an edge because you know what works and what doesn’t.
- You find where you lose money. The expensive mistakes you repeat without noticing.
- You test before you risk. Backtesting on real data, not on theory.
- Replay to relive every trade. You understand candle by candle what you did right or wrong.
Trading stops being instinct and becomes a system.
How is Stratonk different from other journals? One price, every feature
Why Stratonk and not a spreadsheet? Metrics, replay and backtesting — nothing to build
If I cancel, do I lose my trades? Your history is yours — always
What does the free trial include, and can I cancel? Full access, no surprise charges
Measure what you do.
Improve what you measure.
7-day free trial. Cancel in one click whenever you want.